
4 Nov 2026
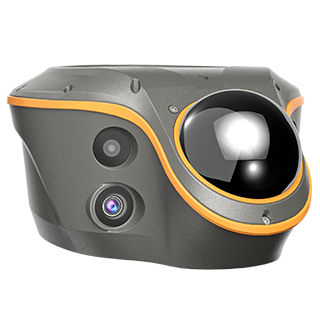
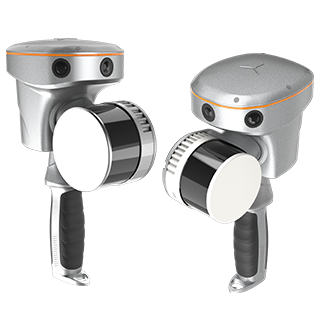
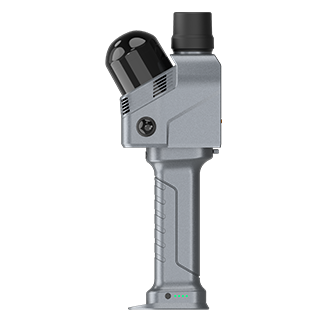
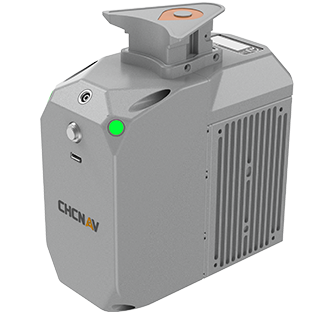
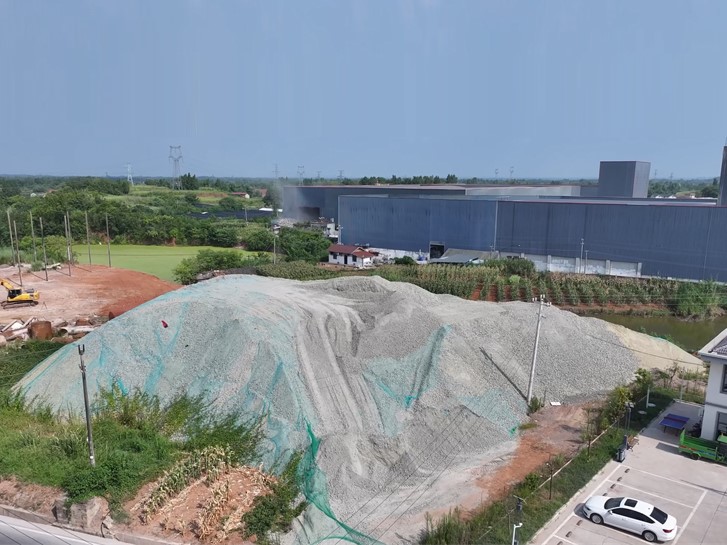
Stockpile and excavation volumes are among the most frequent measurements on a construction site. A contractor needs them to bill for material moved, a site manager needs them to track progress, and a client needs them to sign off the work. The usual stockpile survey is slow on both ends: a surveyor walks the pile collecting points one at a time, then someone in the office exports the data, builds a surface and runs the calculation. This article describes how to perform the same task using the CHCNAV ViLi i100, where the scanning, calculation, and report generation are all performed on the receiver and its controller before the team leaves the site.
If you want to know how a point cloud measurement compares with point by point collection in the first place, question 4 of our seven questions about the ViLi i100 covers it. Here the focus is the workflow itself.
Whatever the site, the deliverable is the same: a volume that the people paying for the material will accept. That means three things.
Collecting points across a rough, loose pile is tiring and exposes the surveyor to slips. Every change of software between the field and the office adds time before anyone sees a result. The ViLi i100 workflow removes both, in four steps.
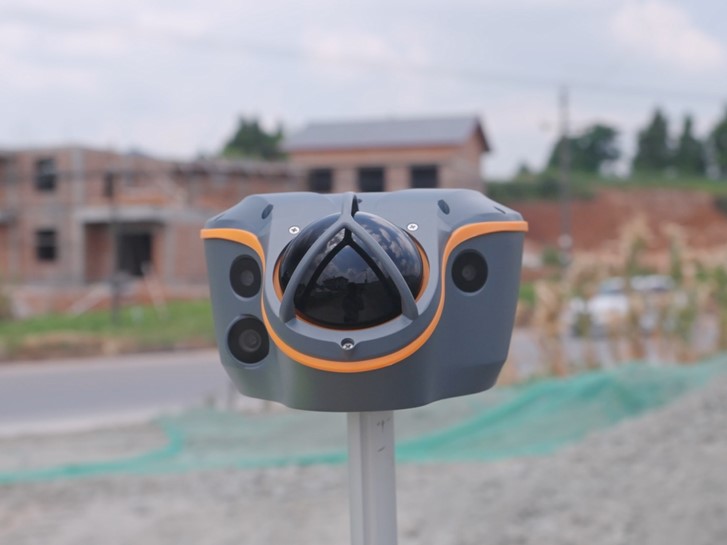
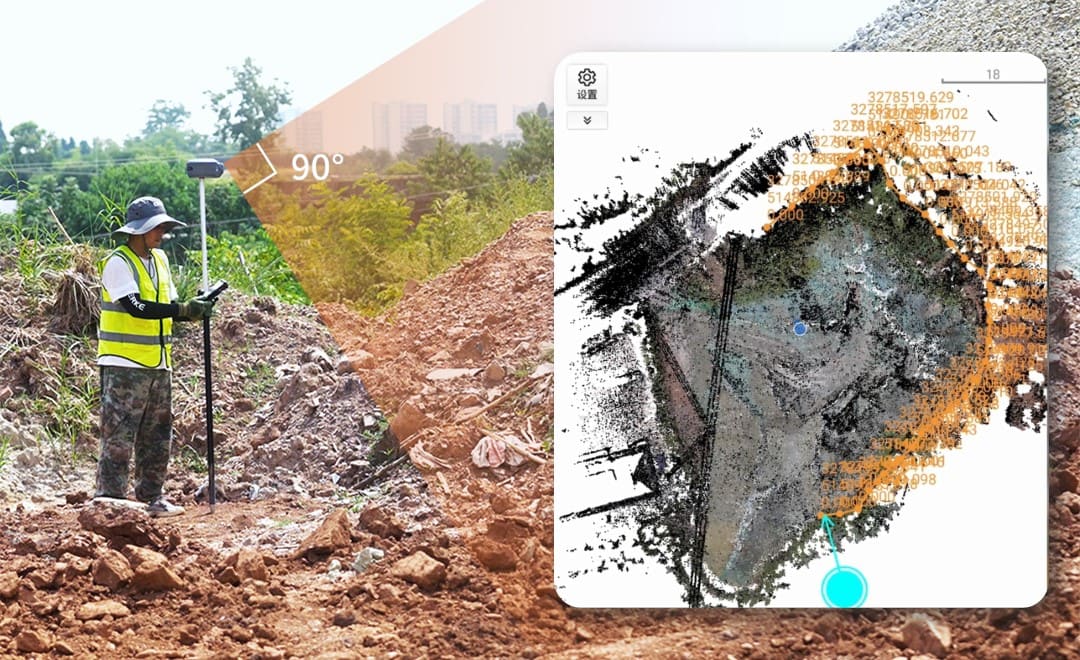
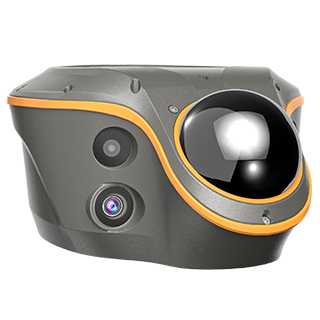
The receiver connects to the controller over Wi-Fi. After initialization, the surveyor walks around the pile and lets the LiDAR capture its surface at up to 860,000 points per second. Two habits give a complete, detailed point cloud: move at a steady pace, and keep a consistent distance from the surface.
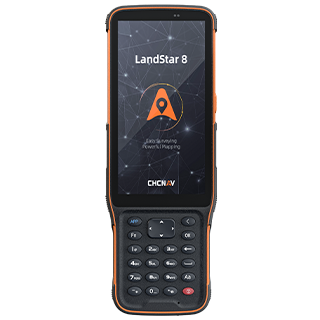
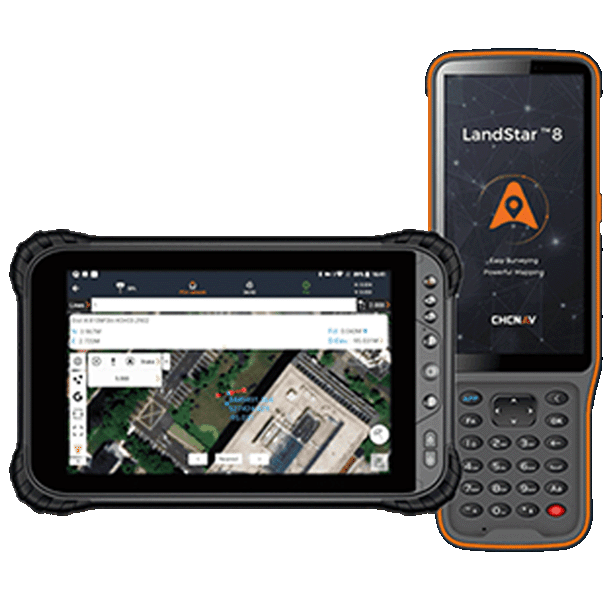
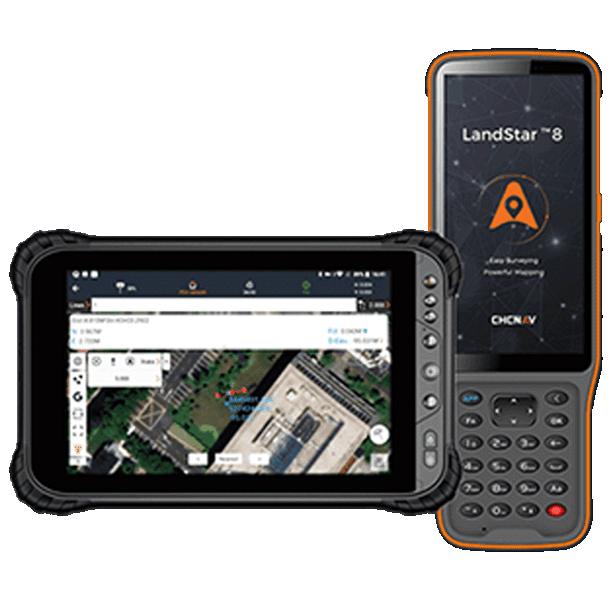
When the scan ends, the controller moves straight into the earthwork calculation in LandStar. There is no computer to switch to and no file to export. Two calculation modes match the two jobs a surveyor usually faces:
| Mode | Typical job |
|---|---|
| Stockpile | Material heaped above the ground, such as soil, aggregate or fill waiting to be used or removed |
| Pit | An excavation below the ground, such as a foundation pit or trench |
The surveyor then draws the boundary of the area to calculate on the screen. Anything outside that line is left out of the result, so data from the surrounding ground or a neighboring pile does not inflate the volume.
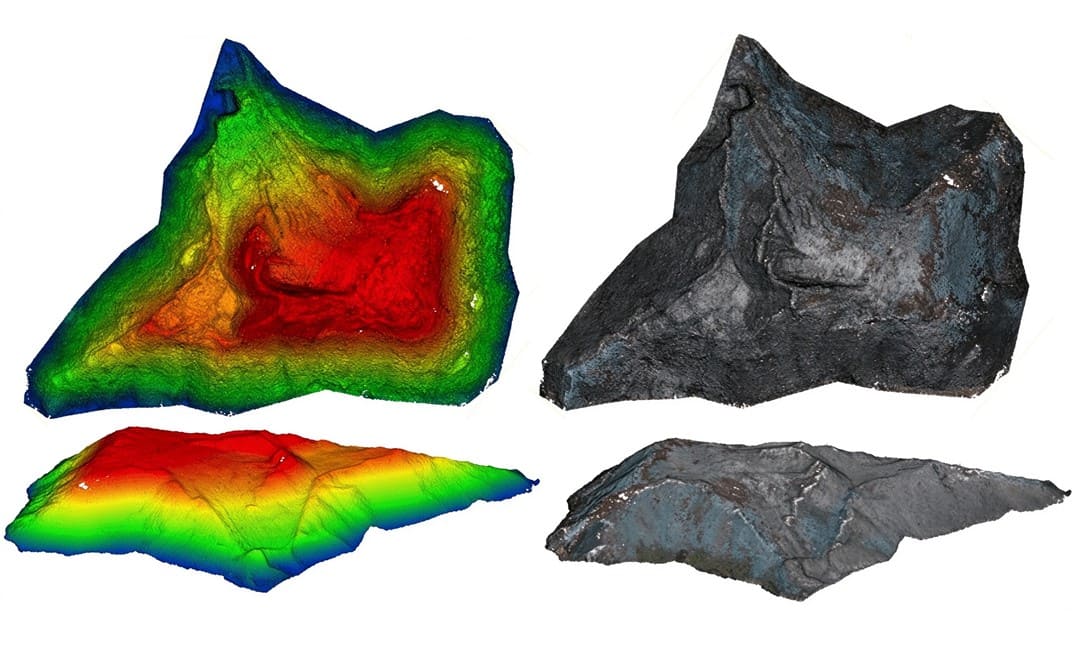
LandStar computes the volume on the controller. The result appears together with the 3D point cloud it came from, so the surveyor can see at once whether the scan covered the whole pile before packing up.
The calculation can be exported as a report in PDF or HTML format, ready to send to the site manager or the client the same day. The report pairs the cut and fill volumes with the point cloud view, which answers the evidence requirement without a separate document.
The point cloud from every survey is saved in the project on the controller. If the volume needs to be calculated again, for a revised boundary or a second check, the data is opened from the project instead of returning to the site.
| Step | Where it happens | What it produces |
|---|---|---|
| 1. Scan | On site, receiver and controller over Wi-Fi | Point cloud of the pile or pit |
| 2. Mode and boundary | LandStar on the controller | The area to calculate |
| 3. Calculate | LandStar on the controller | Cut and fill volumes |
| 4. Report and store | LandStar on the controller | PDF or HTML report, point cloud saved for later |
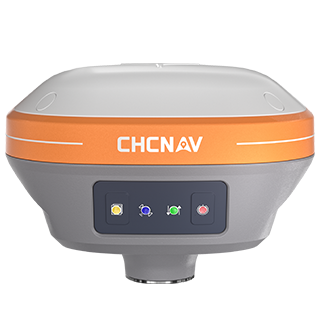
In each case the same receiver also does the rest of the survey work on site, as a standard GNSS RTK receiver. If you are comparing receivers for this kind of mixed work, our guide to choosing a GNSS receiver for your survey site sets the range side by side, and our surveying and engineering solutions page covers the wider equipment set.
CHC Navigation (CHCNAV) develops advanced mapping, navigation, and positioning solutions designed to increase productivity and efficiency. Serving industries such as geospatial, agriculture, machine control and autonomy, CHCNAV delivers innovative technologies that empower professionals and drive industry advancement. With a global presence spanning over 140 countries and a team of more than 2,200 professionals, CHC Navigation is recognized as a leader in the geospatial industry and beyond. For more information about CHC Navigation [300627.SZ], please visit: https://geospatial.chcnav.com/about/overview
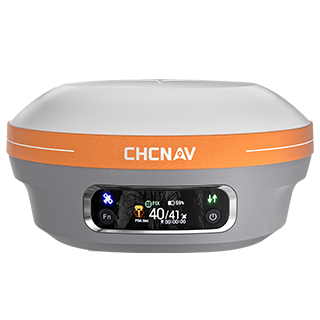
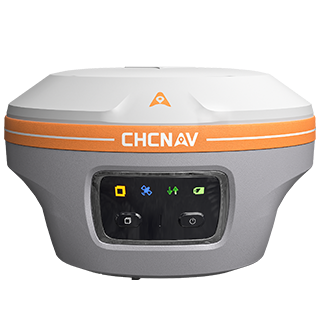
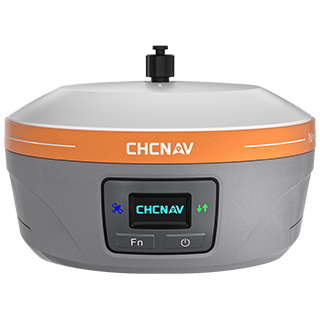
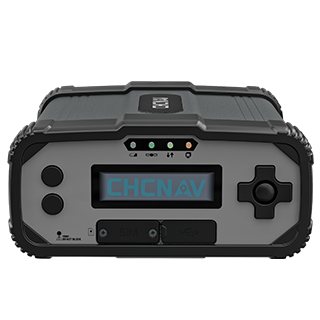
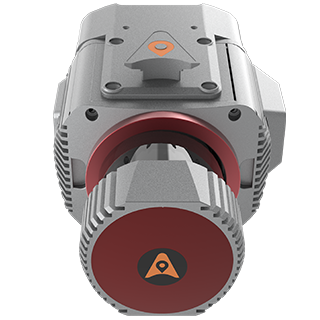
CHCNAV ViLi i100
Visual-LiDAR GNSS RTK receiver with consistent accuracy in obstructions
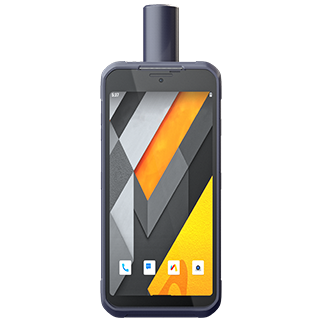
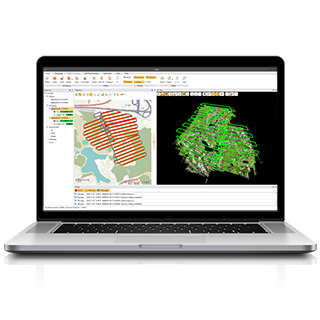
CHCNAV LandStar
Land Surveying and Mapping App