
9 Oct 2026
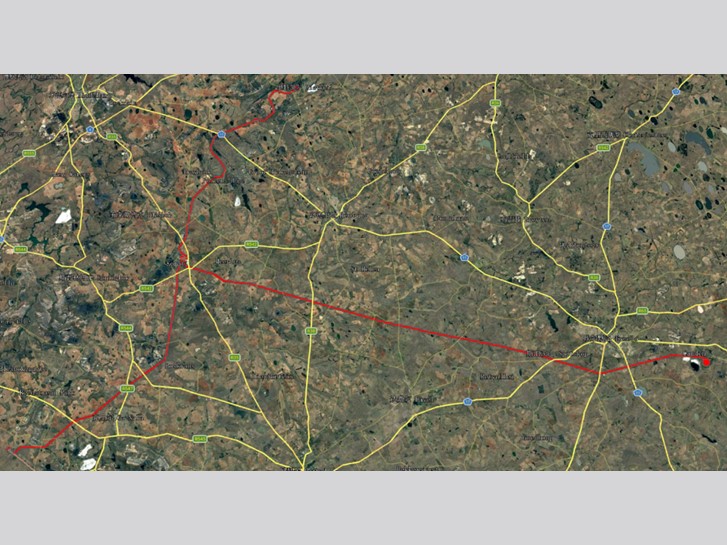
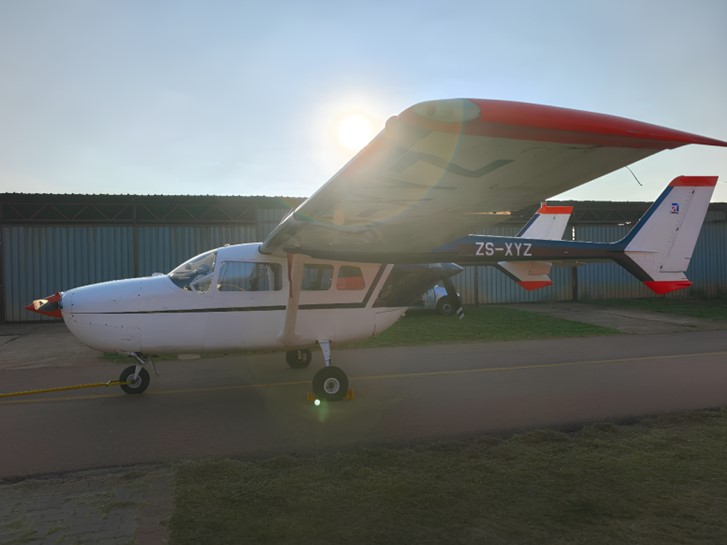
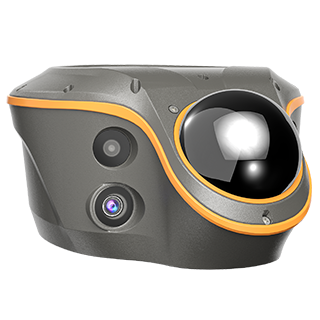
Transmission corridors are some of the hardest assets a utility has to inspect. Lines cross forests, rivers and mountains, towers stand far from any road, and the details that matter most, such as conductor sag, ground wire condition and the clearance between conductors and vegetation, are difficult to measure from the ground or from photographs. In the Komati region of South Africa, Strata Geomatics flew the CHCNAV AlphaAir 15 Pro (AA15P) airborne LiDAR system on a manned aircraft over a 130 km power line corridor to find out whether one flight could deliver the data a power line inspection needs.
Strata Geomatics is a geomatics company in South Africa. For this project, its technical team mounted the AlphaAir 15 Pro on a manned aircraft and scanned a 130 km section of high-voltage transmission corridor. The flight was designed to answer three questions:
The last question was the hardest. In South Africa, overhead ground wires vary in material and diameter, which makes them difficult to capture consistently.
Every common inspection method leaves a gap somewhere:
Airborne LiDAR addresses all of these at once. The aircraft flies well clear of the line, laser pulses reach through gaps in the canopy to the ground, and every point carries a measured 3D coordinate.
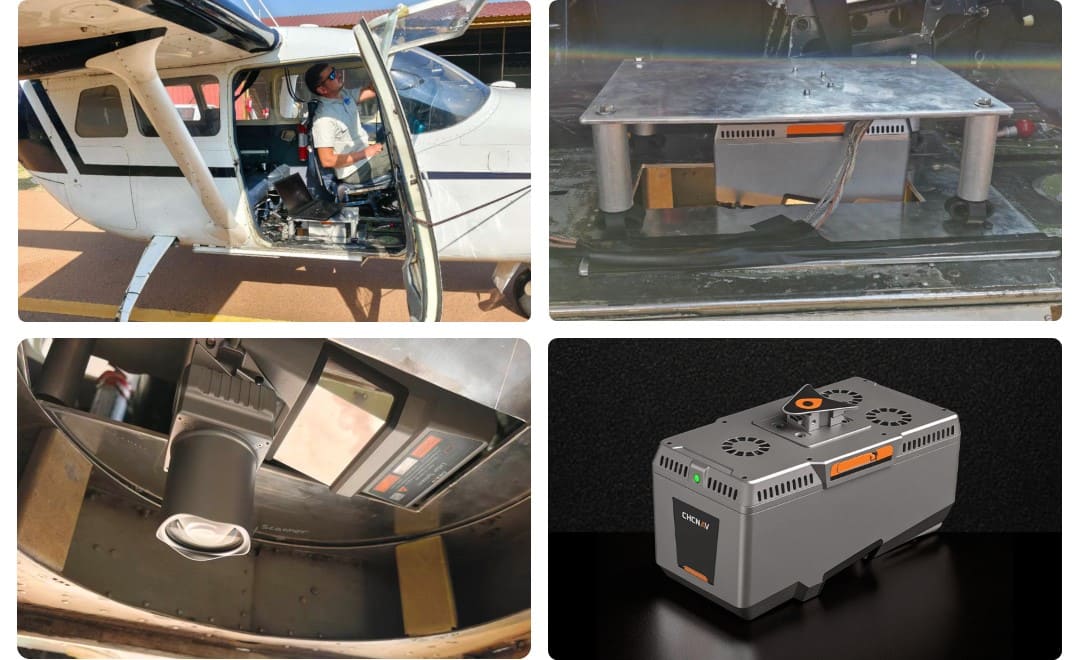
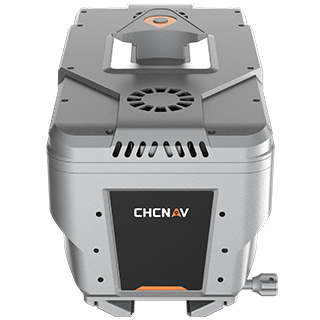
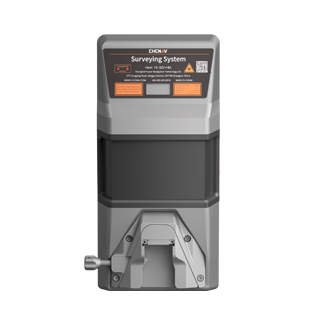
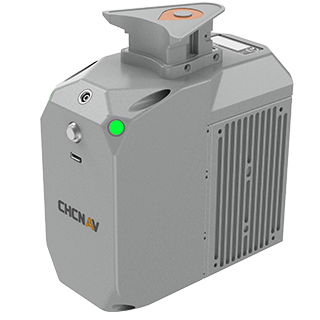
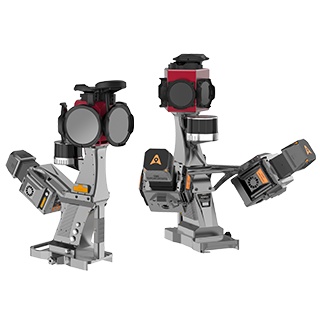
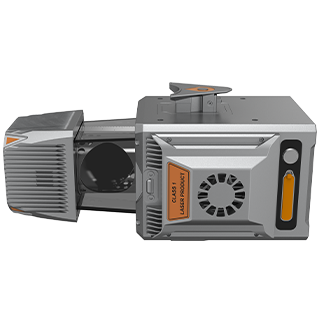
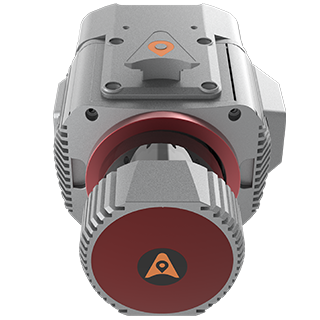
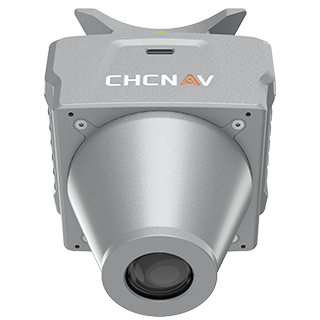
The AlphaAir 15 Pro weighs 2.6 kg, so the same system can be installed on a manned aircraft or on a large fixed-wing UAV, depending on the project.
Three characteristics made it suitable for this corridor:
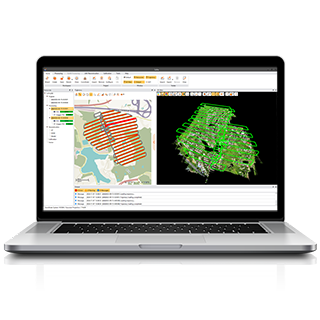
01. Installation and system check. The camera, GNSS and power cables are consolidated into a single A-shaped connector, which simplified installation on the aircraft and reduced the number of connections to check. Before takeoff, the software displayed the self-check status of each component, so the team could confirm the system was ready and avoid configuration errors in the air.
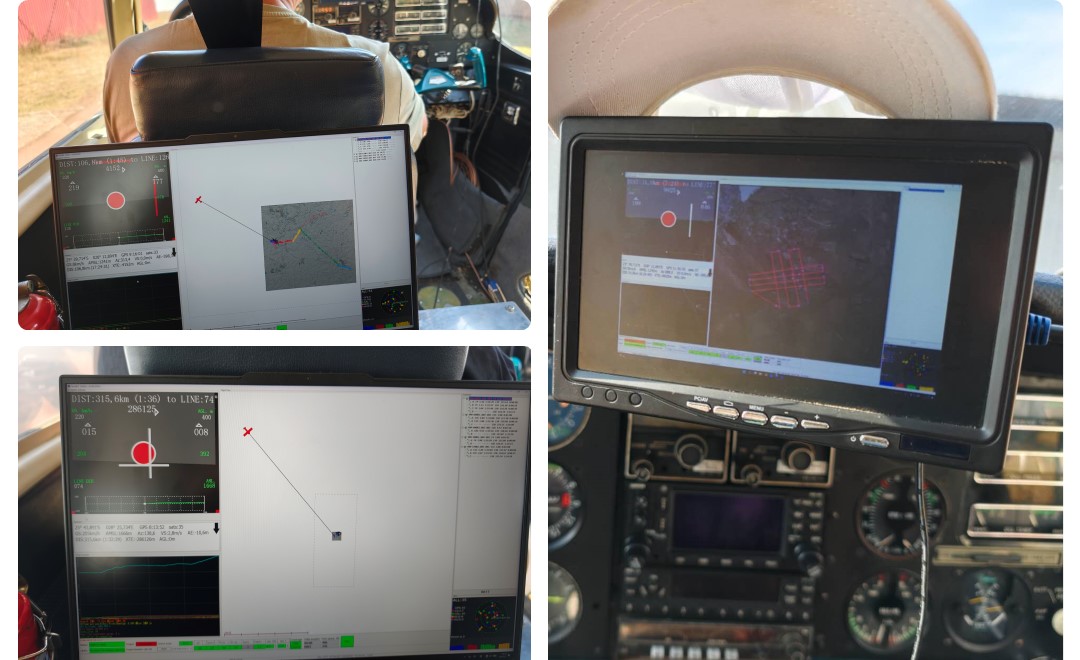
02. Flight and data collection. The aircraft flew the corridor at 120 knots (about 220 km/h) and 500 m above ground. The LiDAR parameters were calculated automatically from that altitude and speed. A real-time preview of the flight plan helped the pilot adjust heading and altitude, and the system controlled acquisition automatically along the preset flight lines, which avoided redundant capture.
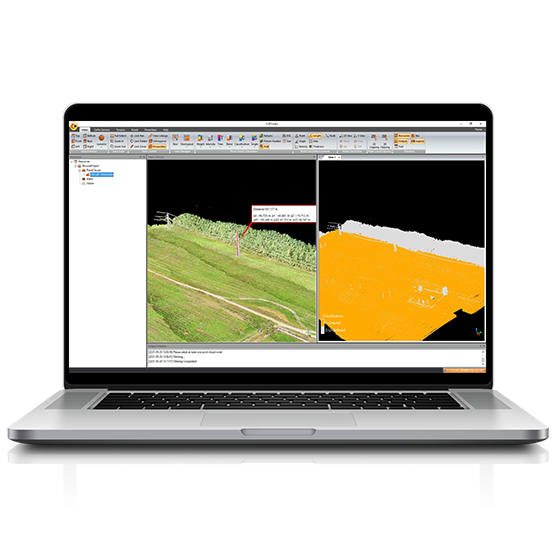
03. Processing. The processing software ran a trajectory accuracy check and highlighted any sections with lower accuracy, so the team could assess data quality before producing the final output. Noise was filtered, and the resulting point cloud was complete and clean.
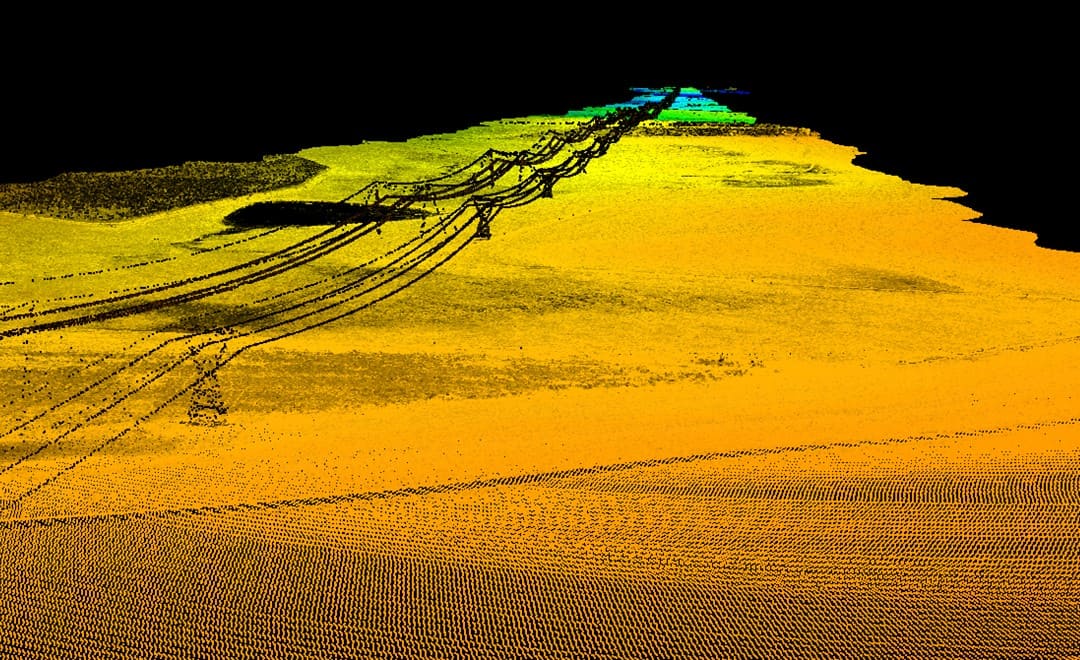
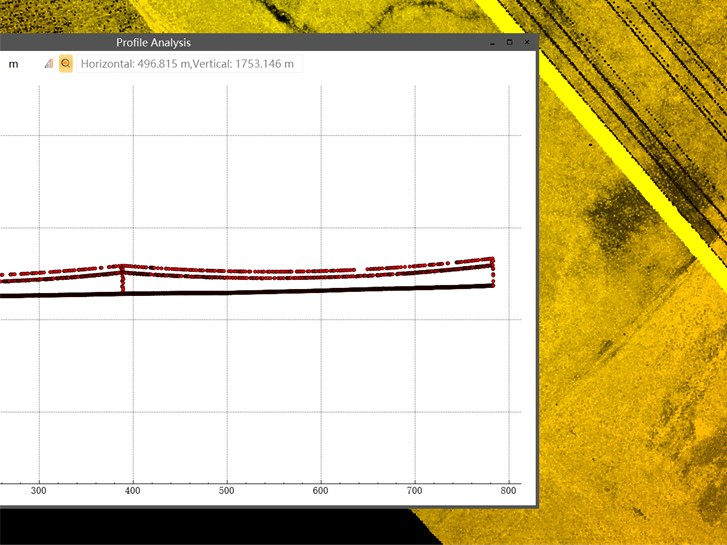
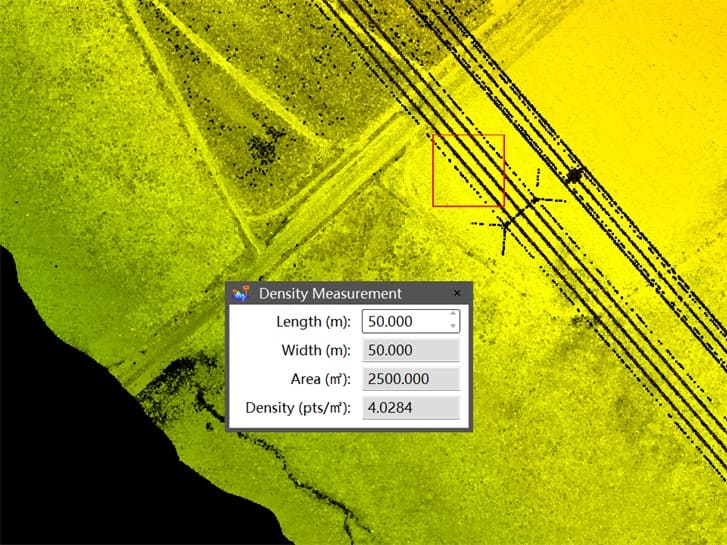
The flight answered all three questions. Coverage along the 130 km corridor was complete, the towers were clearly reconstructed, and the overhead ground wires were captured as continuous lines, with a measured density of 4 points per square meter on the power lines.
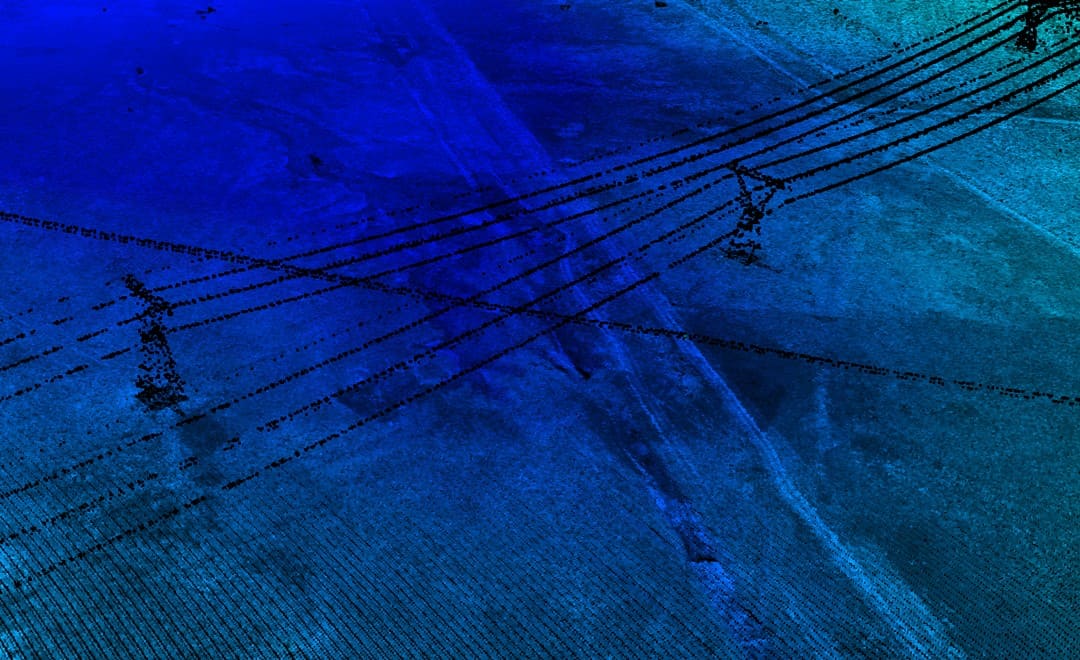
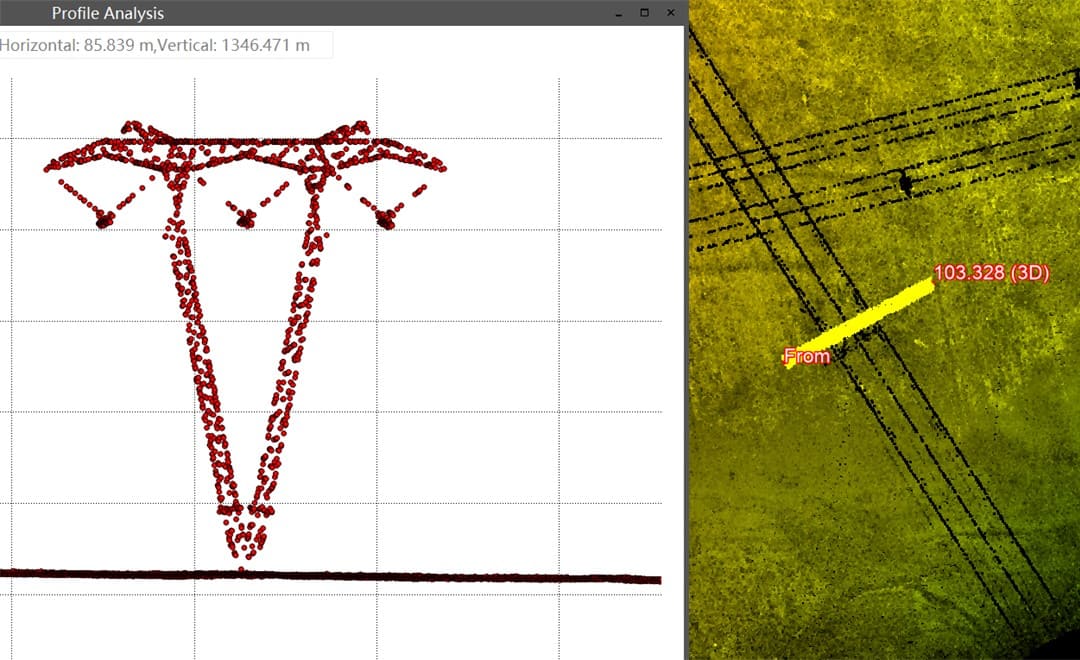
Fine structures held up in the most demanding parts of the corridor. Power lines remained clearly visible where they crossed other lines, including lower-level lines. A cat-head suspension tower was fully reconstructed, with its insulator strings, crossarms and ground wires visible in the profile. That level of detail gives a reliable basis for tower tilt analysis, fitting defect identification and utility asset inspection.
| Outcome | Detail |
|---|---|
| Scope | 130 km high-voltage transmission corridor, Komati region, South Africa |
| Platform | Manned aircraft |
| Flight | 120 knots (about 220 km/h), 500 m above ground |
| Setup | Scanning parameters calculated automatically from altitude and speed |
| Coverage | Complete along the corridor, noise filtered |
| Power line density | 4 points per square meter, measured on the power lines |
| Ground wires | Captured as continuous lines |
| Towers | Insulators, crossarms and ground wires reconstructed |
"Assessing overhead ground wires has long been a challenge in power line inspections. Because of their small diameter and high elevation, capturing them clearly through traditional imagery or low-altitude drone scanning is difficult. With a data acquisition rate of 2.4 million points per second and a 75° field of view, the AA15P delivers high point cloud density. The resulting ground wire data is continuous and complete, making sag variations immediately visible. Issues such as broken or loose strands, which previously required manual tower climbing for visual inspection, can now be identified directly from point cloud data."
Technical team, Strata Geomatics
The table below sets the AlphaAir 15 Pro against the two most common alternatives. The AlphaAir 15 Pro figures are CHC Navigation's typical values for power line work.
| Dimension | Manual ground inspection | UAV orthophoto | AlphaAir 15 Pro airborne LiDAR |
|---|---|---|---|
| Worker safety | Crews work close to live lines | Safe | Safe, no contact with the line |
| Vegetation penetration | None | None | Up to 16 returns per pulse |
| 3D coordinate accuracy | Low | No depth information | 2 to 5 cm RMS |
| Inspection rate | Under 5 km a day | Medium | 90 to 150 km a day |
| Sag measurement | Not measurable | Low precision | Accuracy up to ±5 cm |
| Crossing and span detection | Visual inspection | Partly identifiable | Automated extraction |
For utilities, the most valuable output of a LiDAR power line inspection is often the vegetation clearance data. With up to 16 returns per pulse, laser energy reaches the ground through the canopy, and multi-return classification separates vegetation from conductors so the minimum clearance between them can be calculated. That turns vegetation management from visual judgment into measured, repeatable data.
The same characteristics suit long corridor programs. On a manned aircraft, the AlphaAir 15 Pro can fly more than 1,000 m above ground, well clear of the line. The system is ready within 15 minutes of arriving on site, and its 512 GB removable SSD supports more than 8 hours of continuous acquisition. It operates from -20 °C to +50 °C with an IP64 rating, and it has maintained stable echo quality on conductors of different materials, from highly reflective galvanized steel strands to lower-reflectivity ACSR conductors.
For another AlphaAir 15 Pro project, see how a survey team captured a 70 km pipeline corridor in Namibia in two days, or read how airborne LiDAR supports road surveying. For point cloud processing, explore CHCNAV CoPre.
Download the full case study (PDF)
CHC Navigation (CHCNAV) develops advanced mapping, navigation, and positioning solutions designed to increase productivity and efficiency. Serving industries such as geospatial, agriculture, machine control and autonomy, CHCNAV delivers innovative technologies that empower professionals and drive industry advancement. With a global presence spanning over 140 countries and a team of more than 2,200 professionals, CHC Navigation is recognized as a leader in the geospatial industry and beyond. For more information about CHC Navigation [300627.SZ], please visit: https://geospatial.chcnav.com/about/overview
Have a question about our airborne LiDAR solutions?


.png)